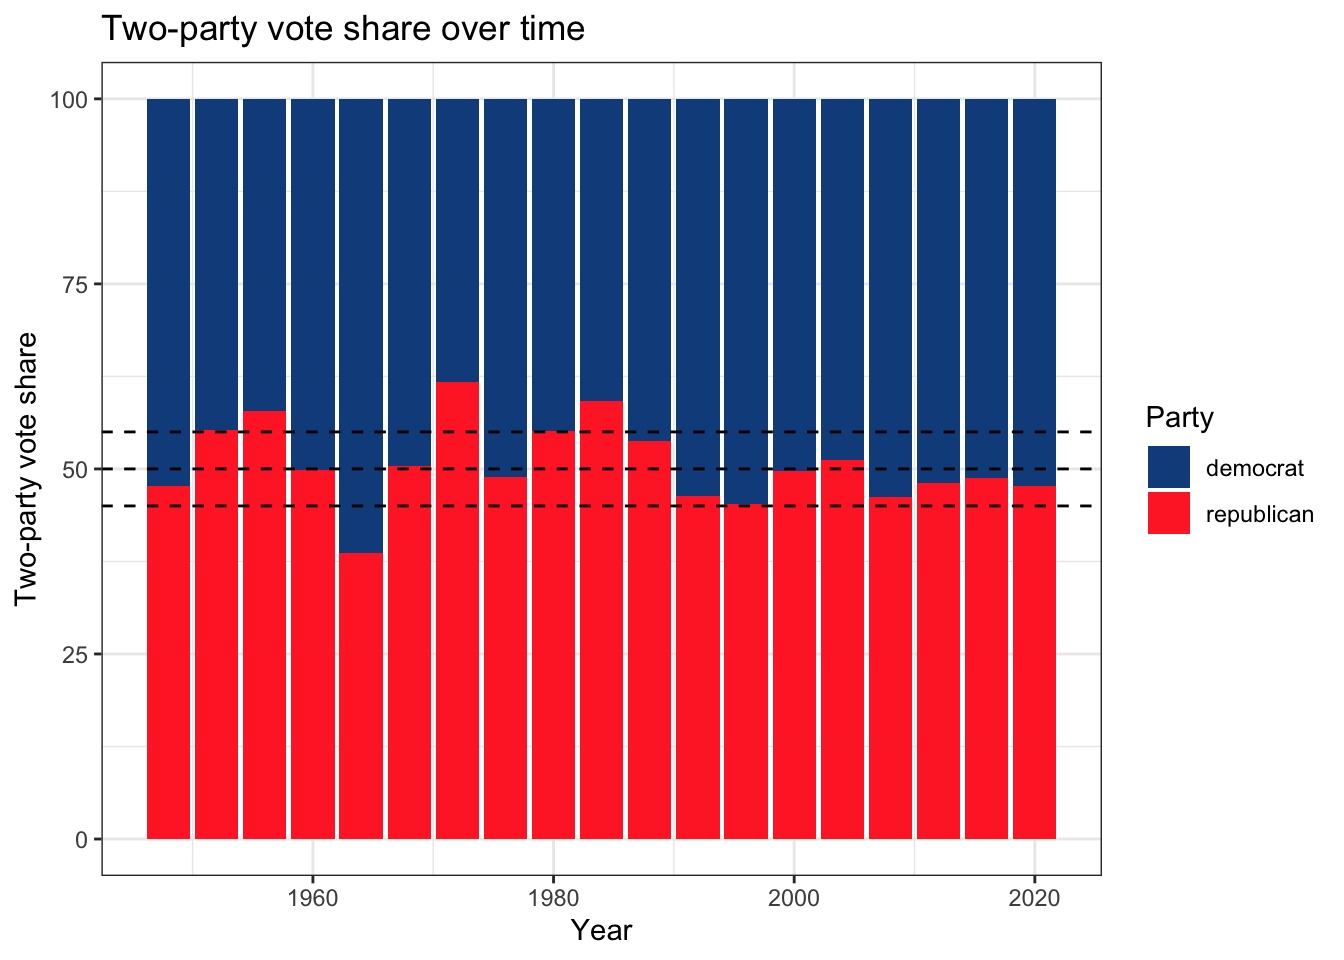
We begin by examining recent US elections. (Code for this post is available on GitHub). Here I have plotted the two-party vote share of the democratic party and the republican party since 1948 until 2020. The data is provided by the course staff. A dashed line is drawn at the 50% mark and two other dashed lines are drawn at a 5% interval. Notice that since 2000, the margin of winning is within 5% for the past 6 elections, while in fact in the past we see elections where the margins are more than 5% (like 1984 and 1968). Elections in the US are getting very close following Pendulum Politics.
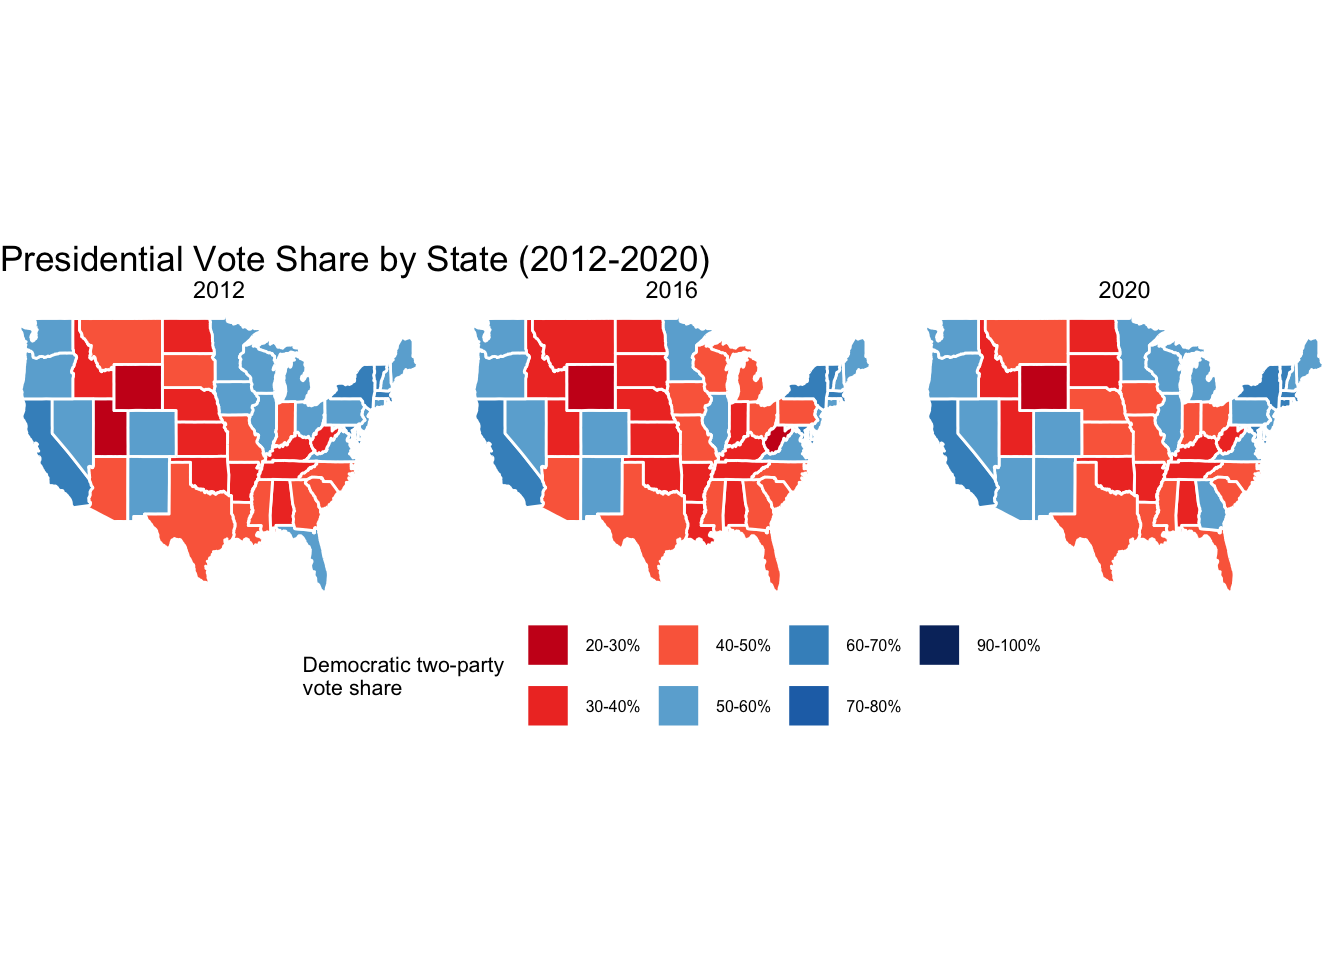
We can look into more granularity by investigating the vote share in each state for the past three elections. It turns out that the coastal cities vote blue alongside Colorado and New Mexico, and this trend is stable over time. The heartland of Republicans are in the middle of the country forming a “red wall” in the middle from North Dakota to Texas.
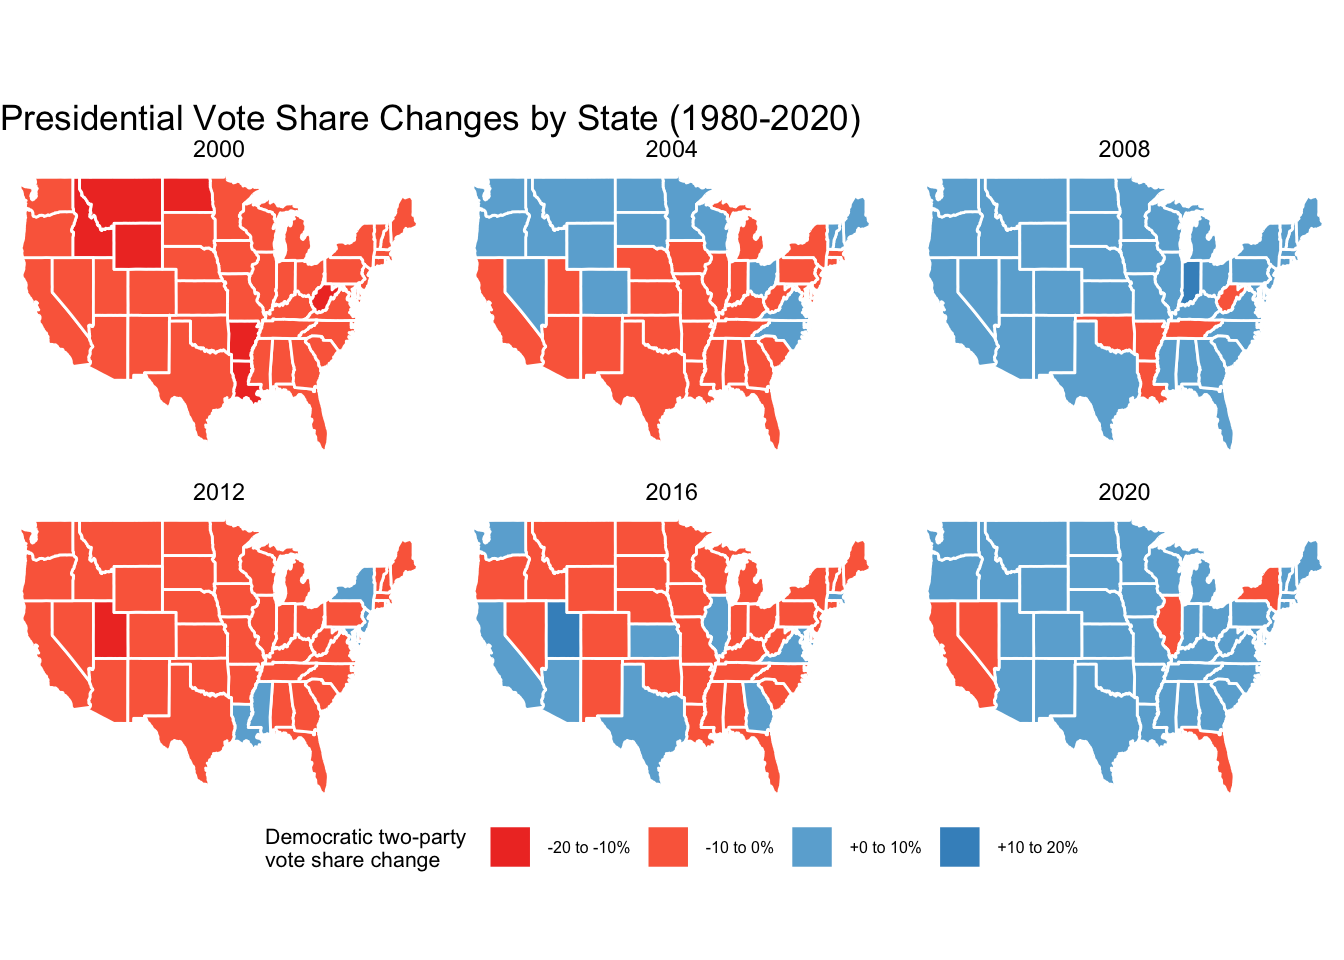
Let’s explore deeper into how these vote shares change over time across states. Here we see an interesting pattern: in 2000 most states see an increase in Republican votes, while in 2004 voters start to vote Democratic back, and in 2008 we see the vote share of Democrats increase across the board. In 2012 which is Obama’s re-election bid we see most states seeing an increase share of Republican votes. In 2016 the same situation in 2004 arises again where states are mixed in their increase of democratic or republican votes, and finally in 2020 we see an increase of democratic vote share across the board. It might be tempting to “fill in the blanks” and assume that in 2024 we will see an increase in Republican votes across all states, but 2024 has a very different situation (post-COVID, dropout incumbents, Trump) so it remains to be seen whether this cycle is stable or merely transient. It is also important to note that most states only see a single-digit movement in terms of vote share changes across elections.
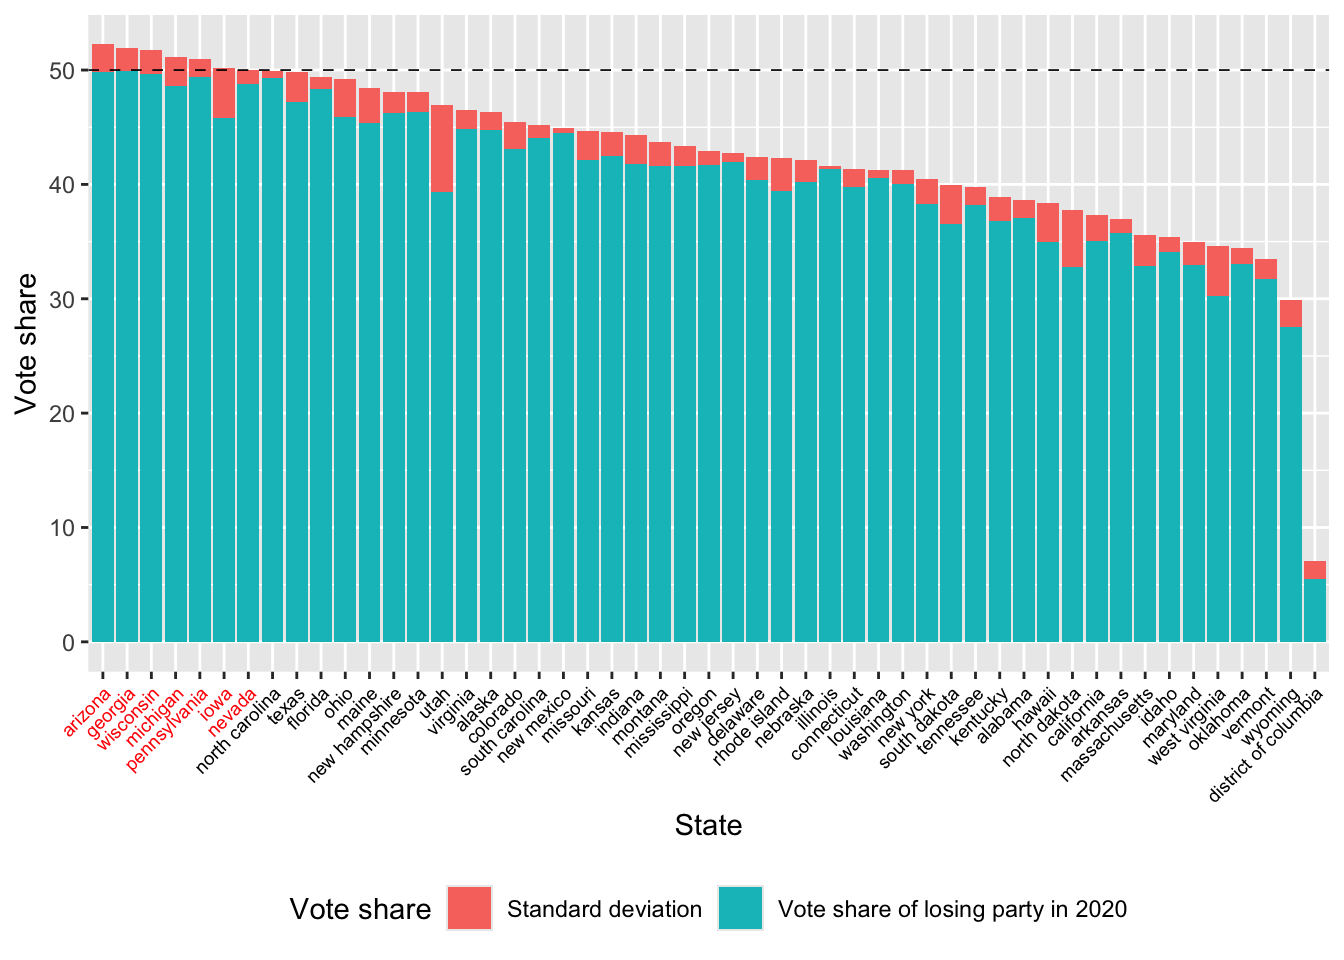
As we have seen that most states are stable in terms of vote share, the most interesting states will be those with a close margin. In those states known as swing states, both parties stand to win their electoral votes. But how do we know which states are swing states? Here I use an approach where I measure the standard deviation of two-party vote shares for the past three elections (2012, 2016, 2020) and then apply it to vote share of the losing party in 2020 by state to see which states has potential to be flipped. By this heuristic, it turns out that Arizona, Georgia, Wisconsin, Michigan, Pennsylvania, Iowa and Nevada has potential to flip in the next election based on this model. Note that this agreesly largely with the current consensus with the exception of North Carolina (which has a total share of 49.9% after adding in the standard deviation and ranks right after Nevada) and the addition of Iowa (which has a high standard deviation of 4%).